I’ve managed projects where everything looked “fine” in a task list… until one small delay quietly knocked three other tasks off track. That’s when I started relying on a simple visual that makes project planning feel far less messy: the Gantt chart.
If you’re here because you’re wondering what is a Gantt chart, here’s the simplest way I can explain it. It’s a visual timeline that shows your tasks, their start and end dates, and how work connects from one step to the next.
Over the years, I’ve seen Gantt charts work for all kinds of teams. Marketing teams planning launches, HR teams scheduling hiring drives, IT teams managing requests, and small teams juggling daily operations. The reason is simple: when work has timelines, handoffs, or even one dependency, a clear timeline beats scattered notes and endless check-ins.
In this guide, I’ll walk you through what a Gantt chart is, why it’s useful in project management, and how to actually use one without overcomplicating it.
What Is a Gantt Chart?
A Gantt chart is a type of bar chart that illustrates a project schedule. In simple terms, it’s a timeline view of your project tasks. Each task appears as a horizontal bar along a calendar timeline, positioned according to its start and end dates. Longer bars indicate longer tasks, and shorter bars indicate quick tasks.
Modern Gantt charts also show relationships between tasks (dependencies) and key milestones or deadlines. Essentially, a Gantt chart gives you a bird’s-eye view of the project’s timeline, tasks, duration, and order of work in one visual.
Why Are Gantt Charts Important in Project Management?
Gantt charts are important because they address these common pain points by providing a clear, unified plan for your project.
Let’s break down the purpose and benefits of using a Gantt chart:
1. Organize and Schedule Tasks Visually
A Gantt chart allows you to map out all your tasks on a timeline, so you know exactly when each task starts and ends. This helps ensure nothing is overlooked and every task has a target date. You can set realistic deadlines and see the overall project duration at a glance.
2. Clarify Task Dependencies
Gantt charts clearly show which tasks depend on others. By linking tasks (e.g. Task B can’t start until Task A finishes), you can avoid starting something prematurely or identify bottlenecks in the sequence. This also helps reveal the critical path – the longest chain of dependent tasks that determines the project’s minimum completion time.
3. Improve Time Management and Scheduling
Because all tasks and timelines are laid out, it’s easier to optimize your schedule. You can identify any time gaps or overlaps and adjust accordingly. The visual timeline makes it simple to see if the project is on track or if deadlines are in danger of slipping.
If you want to go deeper into planning, prioritization, and scheduling techniques, this guide on Project Time Management breaks down proven methods to manage time more effectively across projects.
4. Enhance Team Coordination
A Gantt chart acts as a single source of truth for the whole team. Everyone can see who is responsible for what and when, which reduces confusion and redundant work. It fosters accountability since each team member knows their deliverables and due dates. Cross-team coordination becomes easier when all dependencies and handoffs are clearly mapped.
5. Provide a High-Level Overview for Stakeholders
Rather than poring over spreadsheets or lengthy status reports, managers and clients can look at the Gantt chart and instantly grasp the project’s progress. Upcoming deadlines, completed tasks, and overall timeline are plainly visible. This improves communication with stakeholders, as you can quickly illustrate where the project stands and what’s left to do.
6. Facilitate Proactive Risk Management
With a Gantt chart, you can spot potential scheduling conflicts or resource overloads in advance. For example, if two major tasks overlap and the same person is assigned to both, the chart will make that conflict obvious so you can reassign work or adjust timing. You can also set milestones for important checkpoints, helping the team stay focused on critical deadlines.
In short: A Gantt chart brings clarity, alignment, and control to your project. It turns the chaos of multiple tasks and deadlines into a coherent game plan that everyone can follow.
Key Elements of a Gantt Chart
A Gantt chart is made up of several core components that work together to show how a project is planned and tracked.
1. Tasks (Task List)
Tasks are the individual pieces of work required to complete a project. They are listed vertically on the left side of the chart and each task is represented by a horizontal bar on the timeline. Task lists may also include details like the owner, status, or percent complete.
2. Timeline (Time Scale)
The timeline runs horizontally across the chart and shows the project’s time frame in days, weeks, or months. It provides context for when tasks start, end, and overlap, making the overall schedule easy to understand.
3. Task Bars
Each task appears as a bar positioned according to its start and end dates. The length of the bar shows how long the task will take. Bars may be color-coded or partially filled to reflect task type or progress.
4. Dependencies
Dependencies show the relationships between tasks and define the order in which they must be completed. They are usually displayed as arrows connecting task bars, making it easy to see which tasks rely on others and how delays can impact the schedule.
5. Milestones
Milestones represent important checkpoints such as approvals or phase completions. They have no duration and are often shown as diamond symbols on the timeline to highlight key dates.
6. Resources & Assignments
Many Gantt charts include information about who is responsible for each task or what resources are needed. This helps with workload planning and prevents overallocation.
7. Progress Indicators
Progress is often shown by filling task bars based on completion percentage or changing their color. This allows teams to quickly see what’s on track and what needs attention.
8. Critical Path
The critical path is the longest sequence of dependent tasks that determines the project’s end date. Tasks on this path have no flexibility, so delays directly affect the project timeline. Some tools visually highlight these tasks for easy tracking.
Together, these elements give a clear picture of a project’s schedule, priorities, and progress, which is why Gantt charts are a standard feature in most project management tools.
Who Uses Gantt Charts?
Gantt charts were originally used by project managers and engineers to plan large manufacturing and construction projects. Today, they’re used by anyone who needs to organize tasks over time and keep work on schedule. You don’t need to be a certified project manager to benefit from a Gantt chart.
- Project Managers and Team Leads: Project managers across industries use Gantt charts to plan timelines, manage dependencies, and track progress. Team leads rely on them to coordinate team workloads and ensure tasks align with overall project goals.
- Operations and Resource Managers: Operations teams use Gantt charts to schedule processes, launches, and ongoing work across departments. Resource managers also use them to balance workloads and avoid overbooking people or equipment.
- Cross-Functional Teams: When multiple teams work together, Gantt charts provide a shared timeline that shows how tasks connect and when each team’s input is needed. This improves coordination and reduces miscommunication.
- Clients and Stakeholders: Executives and clients often use Gantt charts to quickly understand a project’s status. A visual timeline makes it easy to review progress without getting into technical details.
- Anyone Managing Complex Plans: Gantt charts are also useful for event planning, marketing campaigns, hiring plans, training programs, and academic projects. If your work involves tasks with deadlines and dependencies, a Gantt chart can help.
In short, Gantt charts aren’t limited to project managers. Anyone coordinating work across time and teams can use them, thanks to modern tools that make them easy to create and understand.
How to Create and Use a Gantt Chart (Step-by-Step)
Creating a Gantt chart is a simple, structured process, especially with modern project management tools. Follow these steps to plan your project and track progress effectively.
Step 1: Identify Essential Tasks
Gantt charts will be rendered useful only when they include every activity needed for successful project completion.
So, the first course of action, obviously, is to list all of these activities. Break down your project milestones into individual units to establish what the various tasks are. Then, for each task, decide its start date and the estimated duration.
Example: You have been awarded the contract for a SaaS application development, and as the project manager, you have made a decision to use a Gantt chart to view all of the tasks and to evaluate the likely timeframe for delivery.
You can start by listing all of the tasks that are necessary for project completion as well as the time frame for each task.
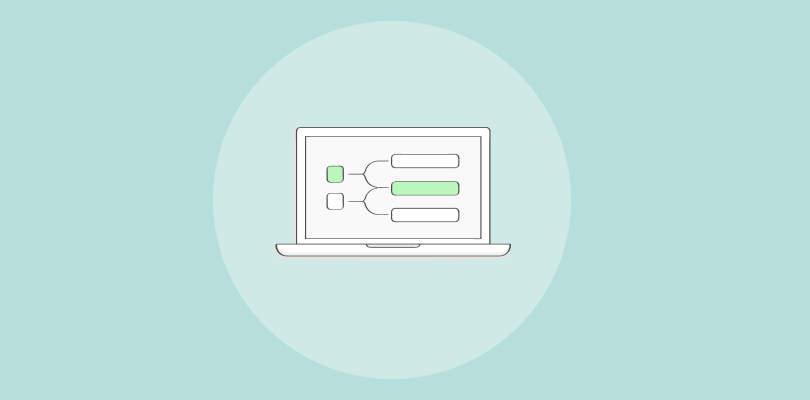
Step 2: Identify Task Relationships
A Gantt chart clearly shows the relationship between all the tasks in a project. Most projects have task dependencies that require some tasks to be completed before others.
In this example, server-side packages cannot be installed before installing the server itself.
These task dependencies are called “sequential” or “linear” tasks.
Other tasks, that are not dependent on other tasks, run in “parallel” – i.e. they can be initiated at the same time as other tasks.
So, at this stage, it’s important to identify which of your project’s tasks are sequential and which ones are parallel.
Tasks can be dependent on one another for several reasons. If you’re making marketing collateral for your social media page, for example, that task would be dependent on the content strategy. That has to be completed first.
Another reason a task can be dependent on another is if it shares a certain resource. Coming from our previous example, all your graphic design tasks would be dependent on the completion of every other task if you only have one artist to work on all of them.
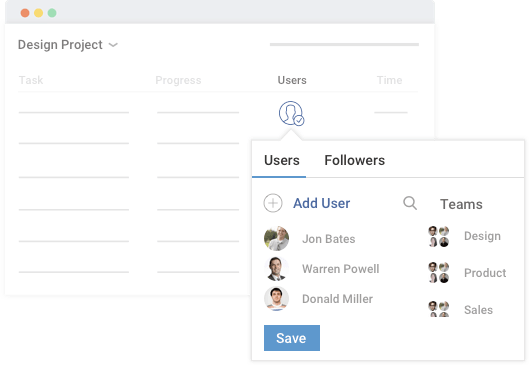
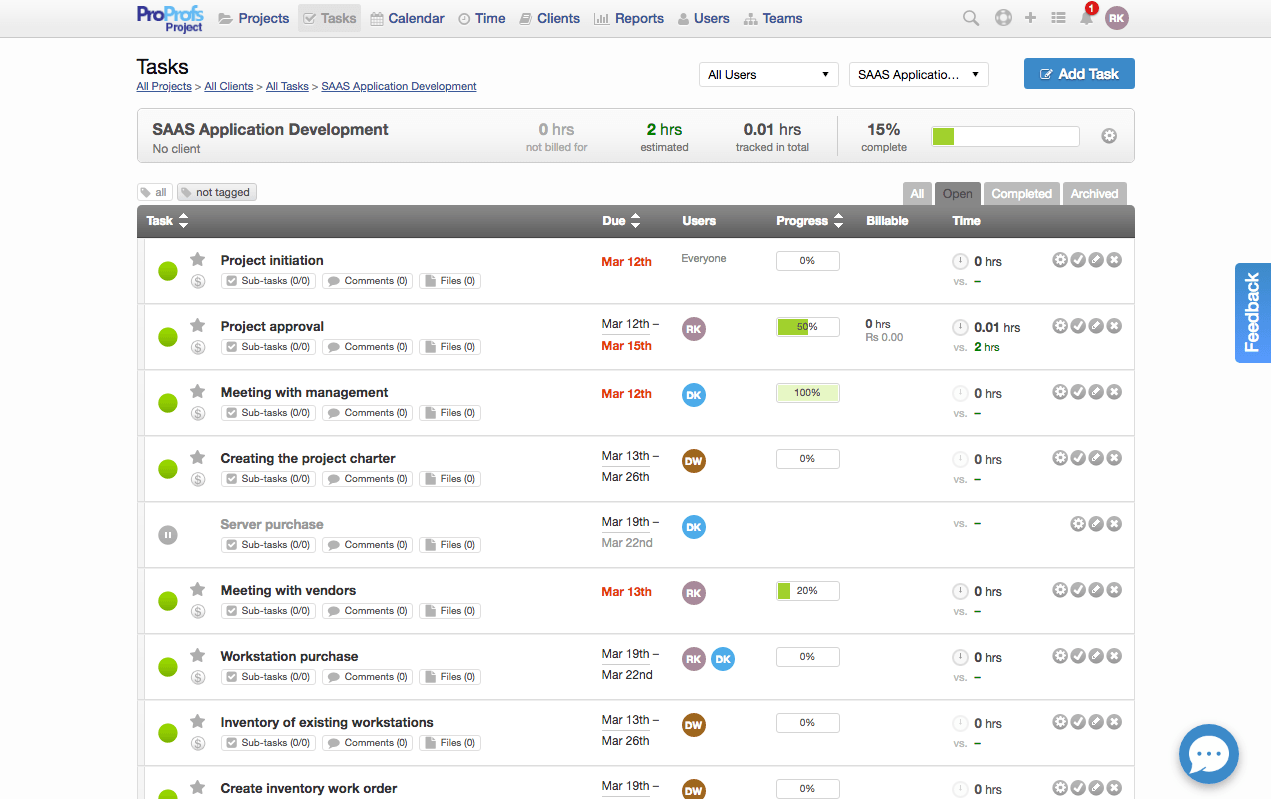
Step 3: Create the Project
To view the progress of each task, it’s time that you create a project in a simple project management software.
Once you’ve created your project add all your designated tasks with due dates, users responsible for their completion, and deadlines for each task. This helps you record the progress of each task hassle-free.
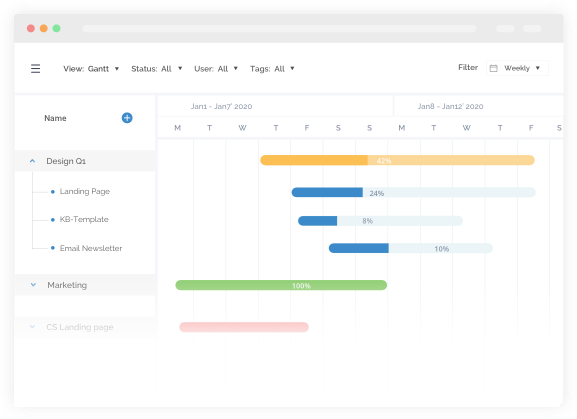
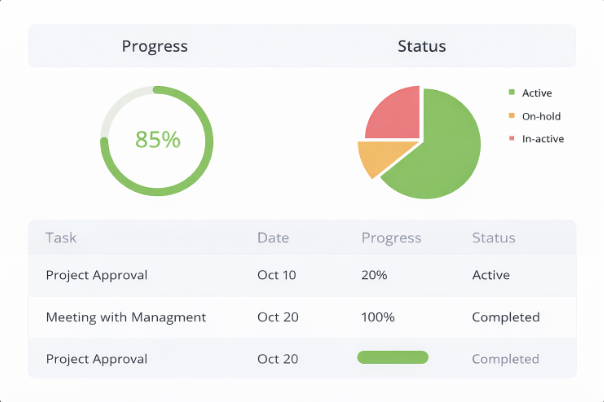
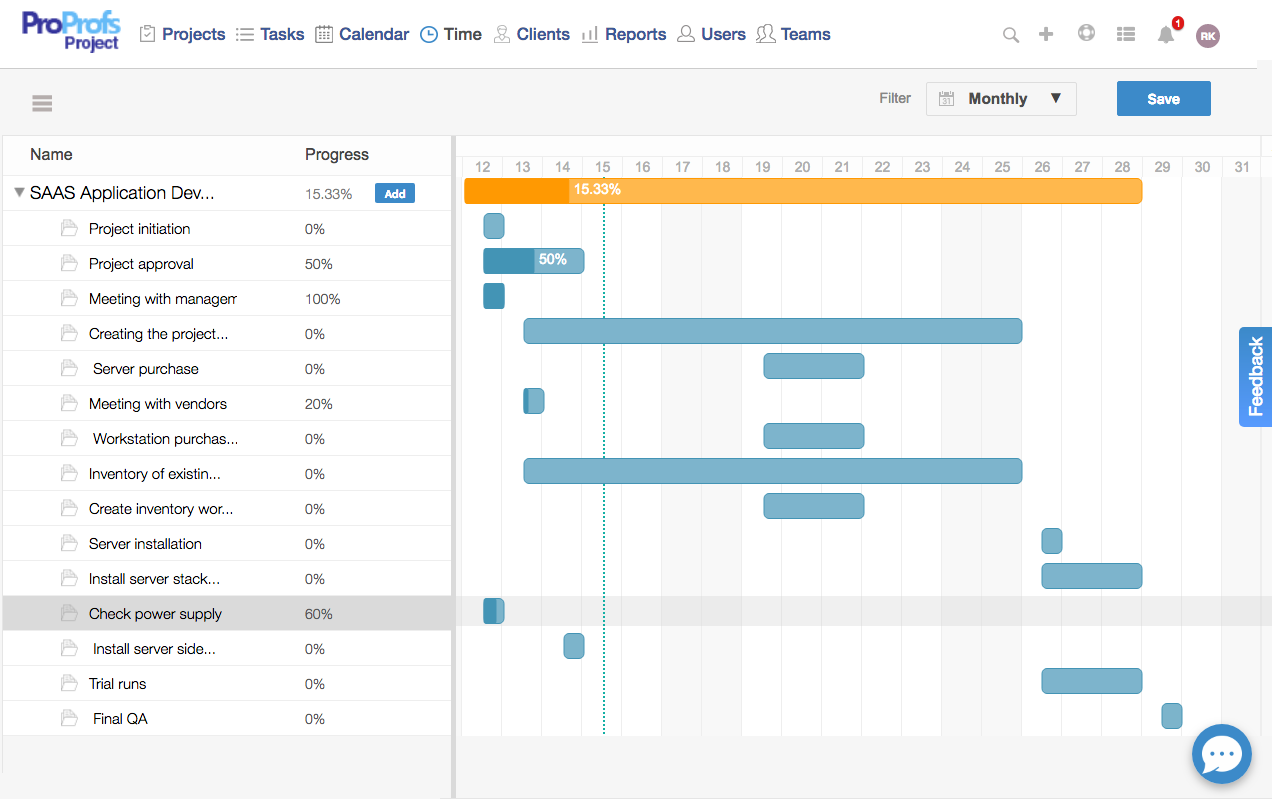
Step 4: Gantt Chart View
Once you’ve created all tasks, it’s time you view their progress through a Gantt Chart view. It’ll help you track the progress of a project, its tasks, and sub-tasks.
You can also edit or add both tasks and sub-tasks. You can easily view which all tasks need immediate attention and are still pending with your team.
This will later help you inform your stakeholders on the progress of the project, therefore increasing the importance of Gantt Chart View for both parties.
Bring Visual Clarity to Your Projects With Gantt Charts
When you’re managing multiple tasks, deadlines, and people, things can quickly get overwhelming. A Gantt chart brings everything into one clear, visual timeline so you always know what’s happening, what’s coming next, and where delays might show up. Instead of reacting to problems late, you can plan ahead, stay organized, and keep your project moving forward with confidence.
The real benefit of using a Gantt chart is clarity. It helps you break big projects into manageable pieces, understand task dependencies, and set realistic timelines your team can actually follow. Whether you’re working with a small team or coordinating across departments, Gantt charts make collaboration easier and progress easier to track — without constant follow-ups or guesswork.
If you’re ready to put this into practice, using a simple project management tool that includes a built-in Gantt chart can make the process much smoother. Tools like ProProfs Project help you create timelines, assign tasks, and track progress visually, so you spend less time managing schedules and more time getting work done.
Frequently Asked Questions

What are the key components of a Gantt chart?
The key components of a Gantt chart include a task list, a timeline, horizontal task bars, start and end dates, task dependencies, and milestones. Together, these elements show how work flows over time and help teams understand the overall project structure.
Are Gantt charts suitable for small teams?
Yes, Gantt charts work well for small teams. Even with just a few people, projects often have overlapping tasks and deadlines. A Gantt chart helps small teams stay organized, plan work realistically, and avoid delays without relying on complex project management methods.
Do I need project management software to create a Gantt chart?
You can create a basic Gantt chart using spreadsheets, but project management software makes it much easier. Software tools automatically handle timelines, dependencies, and updates, helping you keep Gantt charts accurate and useful as projects change.
FREE. All Features. FOREVER!
Try our Forever FREE account with all premium features!