Let’s face it, simply using a tool doesn’t guarantee success. I’ve seen teams try to force-fit RACI chart project management into every project, only to find it doesn’t work unless they align it with their specific needs.
The key is understanding when, why, and how to apply it.
Project management is a juggling act, and without clear role definitions, it often turns into a circus. In my experience, most teams face the chaos of overlapping responsibilities and unclear decision-making paths.
RACI chart project management helps clarify project roles and responsibilities (Responsible, Accountable, Consulted, Informed), improve communication, streamline decision-making, and enhance accountability within a team.
In this guide, I’ll share everything you need to know about the RACI chart: what it is, how to use it effectively, real-world examples, and common pitfalls to avoid.
What Is an RACI Chart in Project Management?
A RACI chart is a simple matrix that defines and clarifies the roles and responsibilities of individuals within a project.
It’s based on the RACI acronym, which stands for Responsible, Accountable, Consulted, and Informed.
Here’s how each of these roles works:
- Responsible: The person(s) who do the work to complete the task.
- Accountable: The person ultimately answerable for the correct and thorough completion of the task.
- Consulted: Those whose opinions are sought are typically subject matter experts.
- Informed: Those who need to be kept up-to-date on progress or decisions.
For example, let’s say you’re planning a product launch.
The Responsible person might be the marketing manager who is in charge of creating promotional materials.
The Accountable person would be the project manager, who would ensure the launch happens on time and within scope.
The Consulted could be the design team, which would provide insights on creative decisions, while the Informed may include senior leadership and the sales team.
Why Do RACI Charts Matter?

RACI charts are powerful because they remove ambiguity, helping teams understand who’s responsible for what and whom they should consult or inform.
When project roles are clearly defined, teams can work more efficiently, avoid duplication of effort, and ensure that no critical tasks are overlooked.
Here’s why RACI charts matter:
- Prevents Role Confusion: By defining roles and responsibilities upfront, you avoid confusion about who’s doing what.
- Ensures Accountability: The Accountable person ensures the task is completed to standard, reducing risk.
- Enables Clear Communication: Teams know precisely who to talk to for approvals, updates, or feedback.
- Improves Team Efficiency: When everyone understands their role, they can work more efficiently without unnecessary back-and-forth.
RACI Matrix Rules – My Observations
Although RACI charts are pretty flexible, I’ve found a few ground rules and guidelines helpful. Let me share them with you right away:
- One person per task: To avoid ambiguity, only one person should be accountable for each task. Too many cooks spoil the broth.
- Engage the right consultants: Be careful not to over-consult. In my early projects, I learned that involving too many consultants can lead to decision paralysis.
- Inform, don’t overload: Keep stakeholders in the loop without overwhelming them with unnecessary details.
- Keep it simple: Avoid overcomplicating the RACI chart. It should be a straightforward document that outlines roles clearly.
- Use it as a dynamic tool: A RACI chart isn’t a “set it and forget it” document. Update it as necessary, especially when roles change or new tasks are added.
Following these core RACI guidelines will help you ensure the chart remains effective and serves its purpose.
RASCI vs. RACI: What’s the Difference?
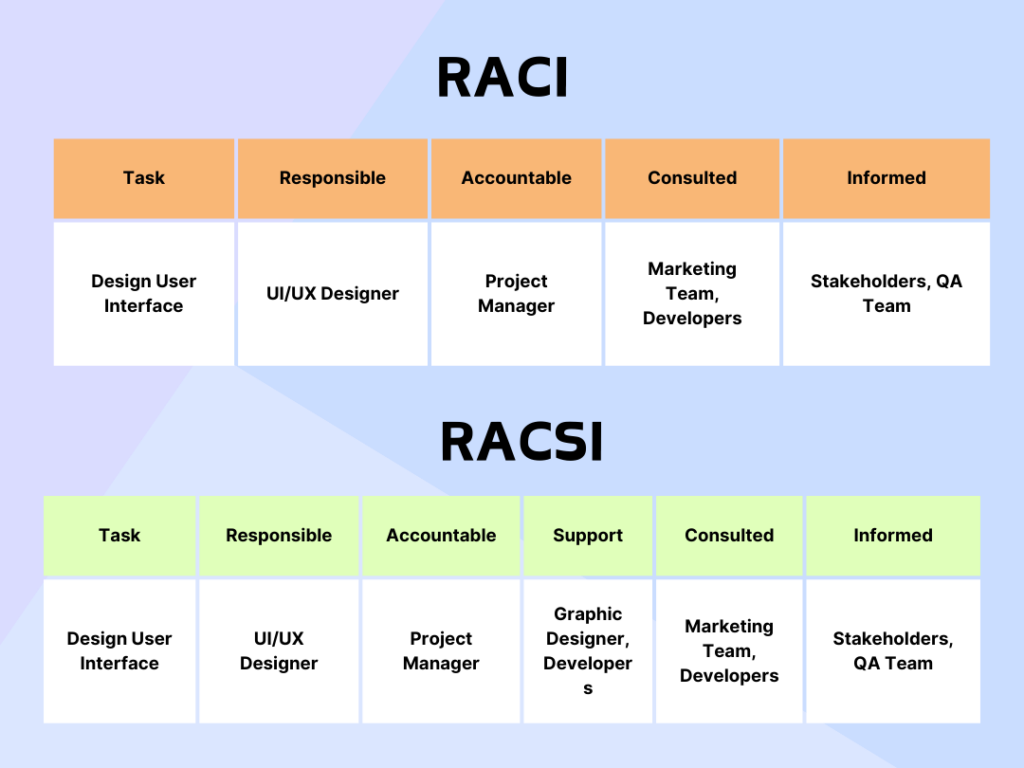
You may also come across a variation called RASCI, which includes an additional role: ‘Support.’
This role is for those who assist the person ‘Responsible’ in completing the task. While it can be helpful in some situations, I generally find that the standard RACI model is sufficient for most projects.
This table should clear your doubts:
| Feature | Responsible | Accountable |
|---|---|---|
| Focus | Doing the work | Ensuring the work is done correctly |
| Authority | Executes tasks | Delegates and oversees tasks |
| Ownership | Responsible for their own work | Owns the outcome of the task |
| Number | Can be multiple people | Ideally, only one person |
How to Create an RACI Chart: Step-by-Step Guide
Creating a RACI matrix isn’t complicated, but like most project management tools, it requires some upfront work to set your team up for success.
The best part is that once it’s built, you’ve got a clear blueprint that prevents miscommunication, confusion, and bottlenecks.
Here’s a step-by-step guide on how to create a project management RACI chart:
Step 1: Identify the Tasks & Activities
Start by listing all the key tasks or deliverables for your project.
This could include designing a new website, developing a product feature, or organizing a company event.
The tasks you list should be granular enough to assign specific responsibilities but not so detailed that they become overwhelming.
In my experience, this step is crucial—if you miss a task, it could throw off your whole project timeline.
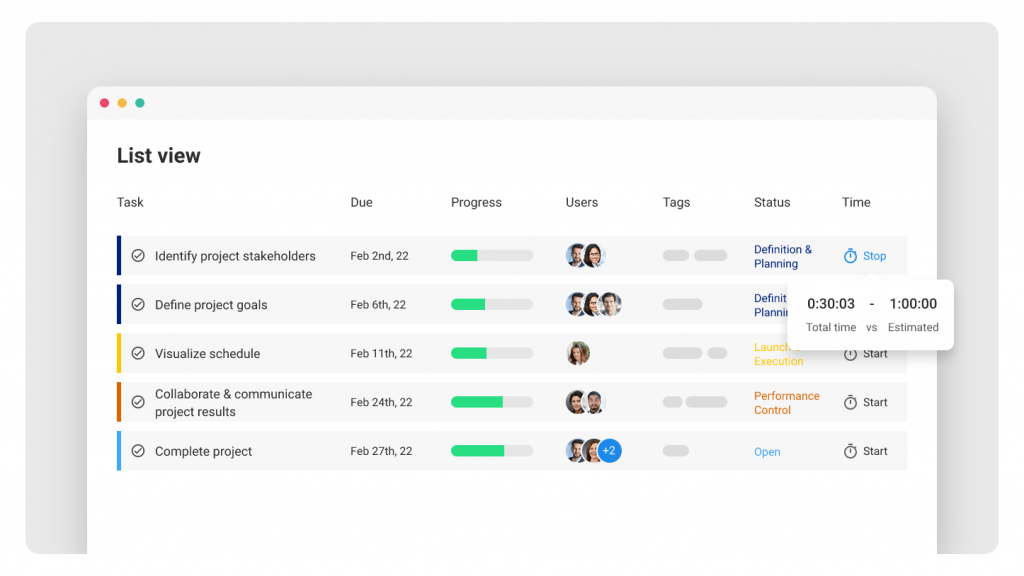
Let me show a real-life example of how Project Management software can help you track progress, focus on your projects, and stay organized.

Step 2: Define the Roles Involved
Next, outline the key roles or individuals involved in the project. You need to consider all the people who will execute the tasks, make the decisions, and provide input.
For instance, a product launch might include roles such as Product Manager, Marketing Lead, UX Designer, and Finance Team.
Step 3: Assign RACI to Each Task
Now, for each task, assign one of the four RACI roles:
- Who is Responsible for completing the task?
- Who is Accountable for ensuring the task is completed?
- Who needs to be Consulted for input or approval?
- Who should be Informed about the task’s progress or completion?
Step 4: Fill in the RACI Matrix
With your tasks and roles defined, it’s time to fill in the matrix.
Create a table with the tasks listed vertically in rows and the roles or individuals listed horizontally in columns. Assign the appropriate R, A, C, or I to each cell. This visual breakdown ensures clarity across your team and highlights any overlaps or gaps in responsibilities.
Here’s a visual representation of what your RACI matrix might look like:
| Task | Project Manager | Designer | Developer | Client |
|---|---|---|---|---|
| Define Scope | A | C | I | C |
| Design Mockups | C | R | I | A |
| Develop Website | I | C | R | I |
| Test Website | C | R | A | C |
| Launch Website | A | I | I | I |
Step 5: Review, Validate & Share
Before you finalize the matrix, get feedback from your team. Does everyone agree on the pre-defined roles? Are there any overlaps or gaps?
In my experience, this review process often uncovers small but necessary adjustments that can prevent future misunderstandings.
Then, once you’ve got your final RACI matrix, share it with the entire team. Keep the matrix accessible throughout the project to keep things running smoothly.
What Are the Best Practices for Using RACI Charts in Project Management?
While RACI charts are highly effective, they work best when used correctly. Here are some best practices:
1. Keep It Simple: Avoid over-complicating the chart with too many tasks or roles.
2. Use It Dynamically: RACI charts should be updated as the project evolves. As new tasks arise or roles shift, make sure your chart is always accurate.
3. Involve the Right People: Make sure the right team members are consulted and informed during each task.
4. Review It Regularly: Schedule regular reviews of the RACI chart to ensure its relevance as the project progresses.
When to Use an RACI Matrix?
Should you use a RACI chart for every project? Does using it in all projects add value, or is it just a waste of time?
These are some of the recurring questions in the RACI chart project management that used to confuse me.
If it does to you, too, let’s clear the air once and for all. Here’s a closer look at when to put one to good use:
1. Large, Cross-Functional Projects
If your project involves various teams or departments, a RACI chart helps align everyone’s efforts. I’ll give a quick example.
Imagine you’re overseeing a product launch that includes input from product development, marketing, sales, and finance. Here, a RACI matrix helps avoid duplication of effort and removes ambiguity.
2. Projects With High Stakes
When the stakes are high, the need for clarity is also high. Projects with significant financial, operational, or strategic impact often benefit from a RACI matrix.
Outlining who is accountable for what reduces the chances of costly errors and miscommunication.
3. Situations Where Roles Are Unclear
Sometimes, teams struggle with ambiguity—nobody knows who’s supposed to do what.
If this sounds familiar, a RACI chart can clarify confusion. This is especially useful in projects where responsibilities overlap, or new team members are being onboarded.
4. Projects With Complex Approval Processes
A project management RACI chart can help when a project requires multiple layers of approval or when several stakeholders provide input.
By designating specific people as consulted or informed, you can reduce endless email chains and make decisions faster.
An raci chart project management template provides a pre-structured framework, simplifying the process of defining and communicating roles and responsibilities, which ensures consistency and reduces setup time for any project.
How to Handle Disagreements in a RACI Chart
Project management conflicts can arise when team members feel that roles are not clearly defined or when there is disagreement over who is accountable for a task.
Here’s how to handle these situations:
- Clarify Roles Early: Before work begins, ensure that everyone understands their responsibilities.
- Facilitate Discussion: If a disagreement arises, bring the team together to discuss the issue and come to a consensus. Ensure that everyone knows their role and the rationale behind it.
- Update the RACI Chart: If necessary, adjust the RACI chart to ensure it accurately reflects the project and its tasks.
Example: If two team members disagree about who’s accountable for signing off on a deliverable, you can quickly resolve this by reviewing the RACI chart and discussing which person holds ultimate responsibility for that task.
What Are Some RACI Chart Examples?
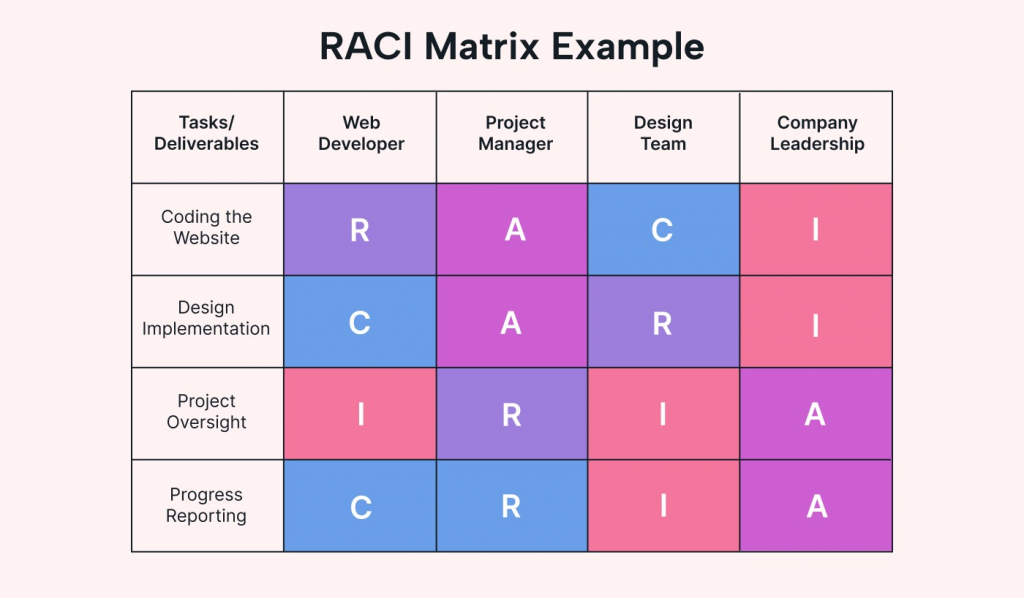
Seeing a RACI chart in action makes it much easier to grasp how to apply this tool to your projects. Below, I’ve included some practical RACI chart project management examples, each illustrating different use cases.
Example #1: Marketing Campaign
Imagine you’re managing a marketing campaign involving content creation, graphic design, and social media. Here’s what a simplified RACI chart might look like:
| Task | Content Manager | Designer | Marketing Lead | CEO |
|---|---|---|---|---|
| Develop Campaign Concept | A | C | R | I |
| Create Marketing Content | R | I | A | I |
| Design Campaign Graphics | I | R | C | I |
| Launch Campaign | I | I | R, A | I |
| Review Campaign Performance | C | I | A | I |
The HR Manager is responsible for preparing the offer letter and conducting onboarding training and is accountable for completing payroll setup.
The hiring manager is accountable for the offer letter and consults on onboarding training.
The IT Department is responsible for setting up the workstation and completing payroll setup.
The New Employee is accountable for attending onboarding training.
Example #3: Software Development Project
Consider a scenario where a software team is developing a new feature. Here’s how the RACI chart might be structured:
| Task | Product Manager | Developer | QA Lead | UX Designer | CTO |
|---|---|---|---|---|---|
| Define Feature Requirements | R | I | C | C | A |
| Develop Feature | I | R | C | I | I |
| Conduct Testing | I | C | R, A | I | I |
| Design User Interface | C | I | I | R | A |
| Approve and Launch Feature | I | I | C | I | A |
Let’s decode what happens here.
The Product Manager defines the requirements, the Developer builds the feature, and the QA Lead oversees testing.
The CTO is accountable for major approvals, while the UX Designer ensures the interface is user-friendly.
Stay on Top of Your Project Outcomes With RACI Charts
RACI chart project management is key in defining who is responsible, accountable, consulted, and informed. I’ve experienced firsthand how it brings order and clarity to even the most complex projects.
However, like any tool, RACI charts have limitations. They require thoughtful planning and ongoing updates to remain effective, especially in dynamic environments.
This is where having a project management tool like ProProfs Project is simply better. Why?
A project management solution simplifies the process of creating and maintaining RACI charts by providing built-in features for role assignments, task tracking, and communication. This ensures everyone remains aligned and up to date.
FREE. All Features. FOREVER!
Try our Forever FREE account with all premium features!

