Have you also faced hiccups while using a Gantt chart? Are these issues getting too frequent to be ignored anymore?
If the answer to both these questions is yes, then you know what it’s time for.
Yes, it’s time to look for alternatives to Gantt charts.
Don’t worry. We know the fad around Gantt Chart Alternatives is real, but let’s admit it, we all have faced issues that hinder project success time and again. Think about it. The bar charts often get too complex to read when handling multiple projects. Also, you might have found it difficult to update the charts constantly.
Guess that calls for trying our hand at a new alternative, right?
While a Gantt chart is undoubtedly an excellent way to visualize a project’s life cycle, a few alternatives such as Scrum boards online, mind maps, and more fill in the gap that a Gantt chart often creates while executing a project.
Here, we will explore the top 8 Gantt chart alternatives that you can rely on for seamless project management.
What is a Gantt Chart?
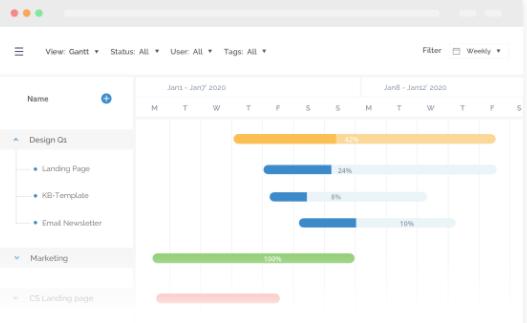
A Gantt chart clearly illustrates the project’s life cycle on its beautiful bar charts. It displays the tasks, resources, and the entire schedule of a project.
You can create Gantt charts easily, depicting which resource is allocated to which task and the timeline of each project task and activity.
These Gantt charts are great for tracking project progress and keeping team members in the loop always. This way, you can streamline workflows and enable better project outcomes.
How Does a Gantt Chart Compare to Other Gantt Chart Alternatives?
Admittedly, a Gantt chart comes with its fair share of advantages and disadvantages. Not all projects may run smoothly with the help of a Gantt chart.
If you’re here searching for alternatives to Gantt charts, then we’re sure that you have most likely faced the following dilemmas:
- Difficult to setup – A Gantt chart can be difficult to set up, especially when working on multiple projects. It can be time-consuming to set the start and end dates of each task and define their resources.
- Can become complex to read – Often, Gantt charts can get too complicated to read. It can be cumbersome to locate a specific task amid multiple ongoing projects.
- Bar charts fail to indicate the exact amount of work – A bar chart does not indicate the number of resources required to complete a task. It merely displays the time that will be taken to complete the task.
For instance, a task with a smaller bar chart might need more resources when compared to a task with a longer bar chart.
- Tedious to update – Undeniably, updating a Gantt chart time and again is no easy task. Thus, if a specific task is delayed and demands a different due date, you have to go back and change its due dates and check resource availability for those dates, thus altering subsequent tasks as well.
Thus, you may discover that a Gantt chart alternative is more suitable for certain projects and teams. So let’s now explore the most popular and best Gantt chart software.
Read More: How to Make a Gantt Chart: Step-by-Step Guide for Beginners
8 Best Gantt Chart Alternatives for 2024
Here are a few Gantt chart examples and alternatives that you can look out for in 2024.
1. Project Timelines
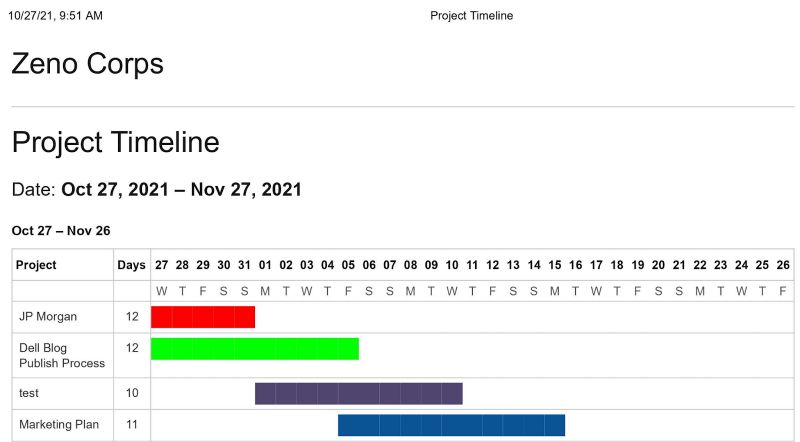
As one of the popular Gantt alternatives, a project timeline clearly defines each task and subtask in chronological order. It also helps set task resources and define task deadlines.
Its horizontal bar charts depict the project’s entire life cycle. It involves breaking down a project into tasks and accomplishing them, one task at a time. You can view which tasks and deliverables are due and get to work immediately.
2. Task Lists
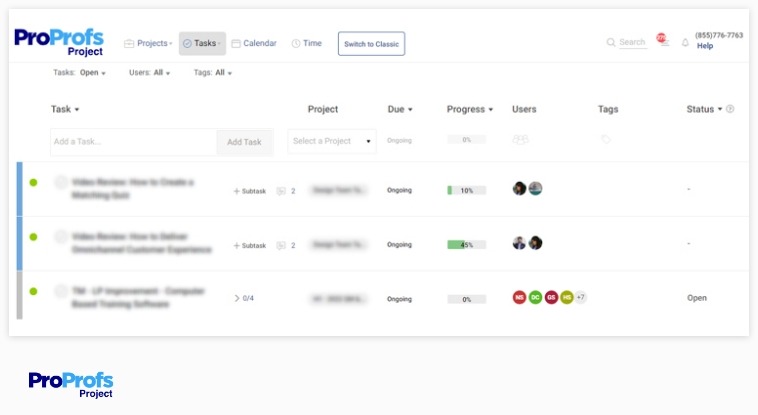
A task list lists down each task of a project. It details the task timeline and resources, leaving no room for discrepancies.
It lists every information related to the task in a list, organizing it so that the project plan is clearly laid out to be effectively followed. This helps manage your day-to-day work in a simplified manner.
3. Kanban Boards
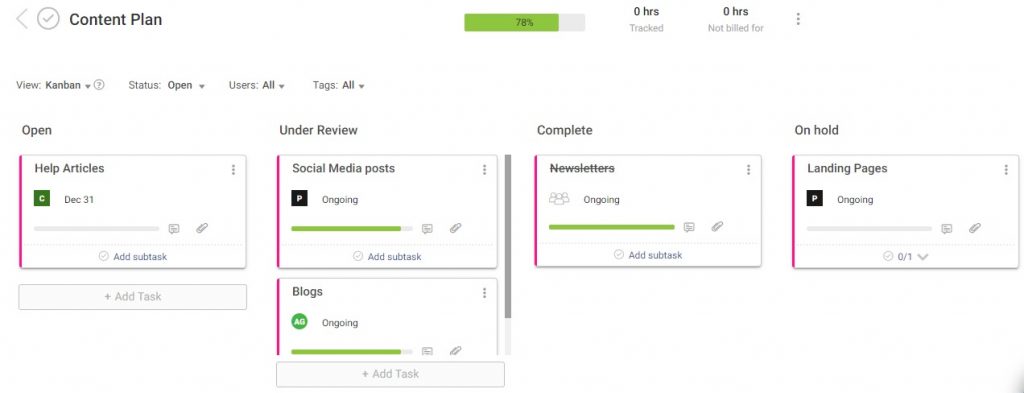
Kanban boards consist of cards and columns that specify a certain task to be completed. It outlines the tasks of a project, making project visualization easier.
You can move task cards to other columns with simple drag and drop functionality. These columns may define which tasks are ongoing and which are on hold. Thus, you can track project progress simply with one glance at the Kanban board. A Kanban board is great for visualizing project status from start to finish.
Read More: 18 Best Kanban Board Software for 2022
4. Scrum Boards
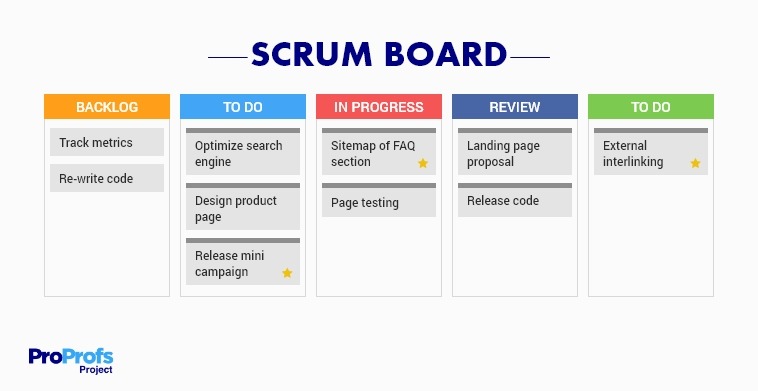
When it comes to projects that demand flexibility and versatility, scrum boards are your best bet. It is one of the best alternatives for Gantt chart, maximizing efficiency along the way.
It is a great technique for ever-evolving projects. We all get projects that have no fixed path. Their execution path gets clearer as the project progresses. Also, such a project receives frequent changes throughout its implementation. Thus, for such projects, a scrum board adapts perfectly to incorporate required changes and enable a smooth-flowing project that is implemented in sprints of not more than two weeks.
Read More: Kanban vs. Scrum: Which to Use?
5. Project Checklist
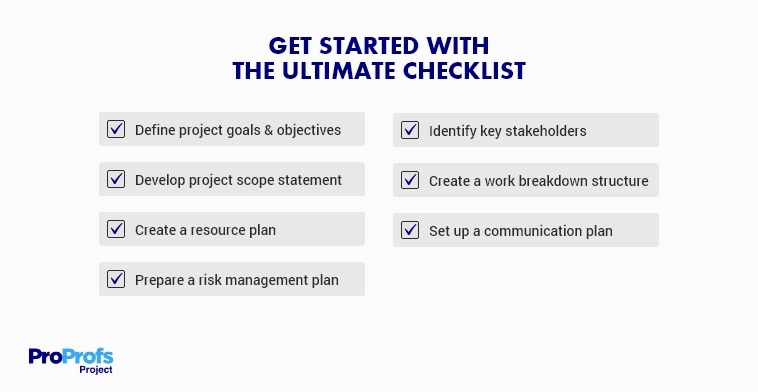
This Gantt alternative is pretty easy to comprehend. You simply create a list of all the project tasks and check them off when you complete them.
Ensure that this project list is to-the-point and does not include any unnecessary tasks that may lead to delayed deadlines.
Read More: Project Management Checklist | A Key to Success
6. Mind Map
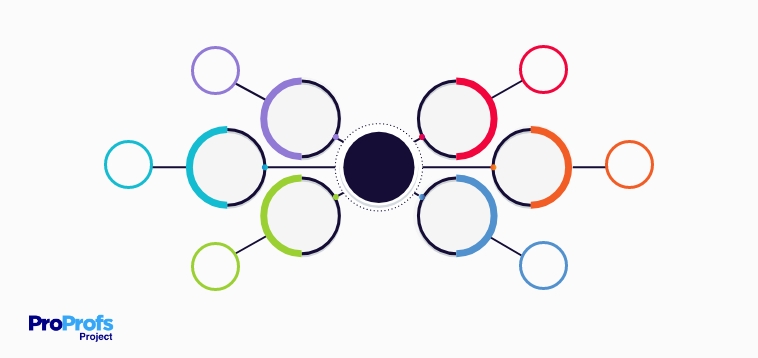
A mind map is an excellent way to organize concepts and set the right tasks to be executed.
It involves creating a map that revolves around accomplishing a specific task. It does this by creating branches that depict tasks to be undertaken. This way, it shows the relationship between the central concept and the outlined tasks. This also depicts the direction that your project execution must take, easing project management tenfold.
7. Project Dashboards and Reports
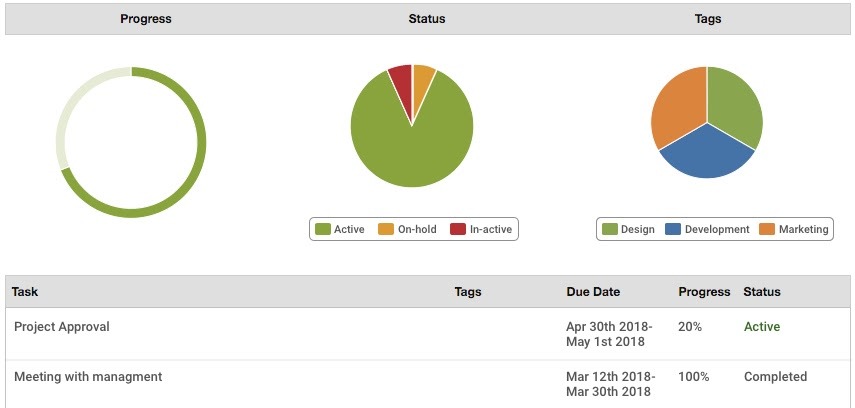
A project dashboard and reports are awesome alternatives for the Gantt chart. A dashboard displays key performance indicators, easing overall project management. Moreover, actionable project reports ensure that your project is always on the right track. These reports help identify project gaps and team pain points, allowing you to fix them at the earliest.
8. Flowchart
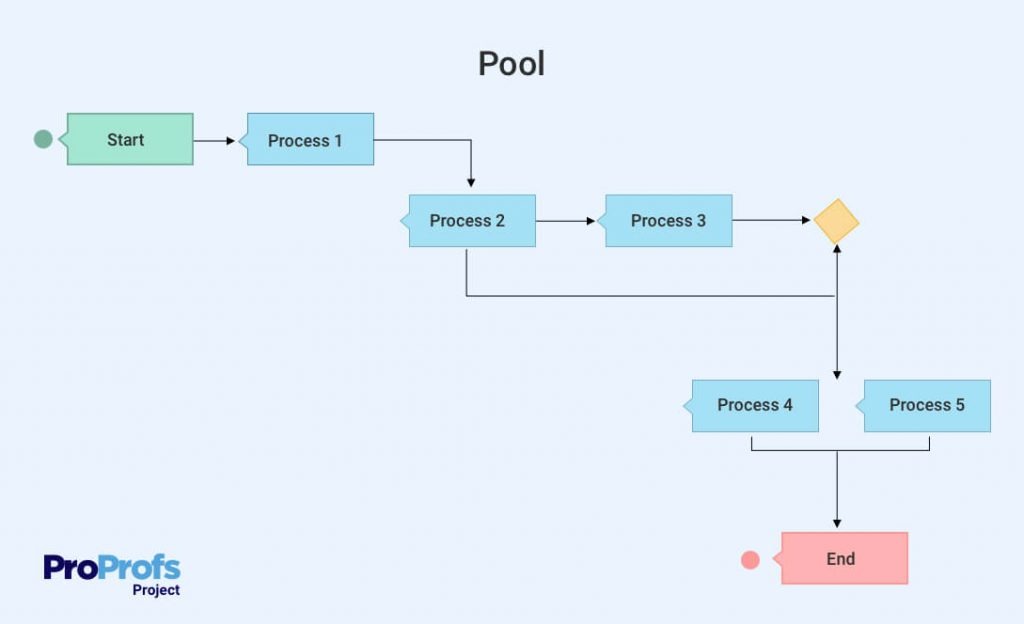
A flowchart uses various symbols such as rectangles, circles, diamonds, and squares to depict the processes of a project. It shows the direction of project tasks and activities with an arrow.
The diagrammatic representation is the simplest way to outline project activities and display the sequence of tasks that must be executed to achieve project goals and objectives.
Read More: Workflow Diagram: What, When, Types & Steps to Create One
Try ProProfs Project – a Complete Solution to Manage Projects
As project managers, we are always looking for a secret recipe or that magic wand that promises to ease project management. Here, it becomes crucial to try a few techniques and adopt the one that best complements your project and workflow needs. Also, it’s best to team the technique with a robust tool, further ensuring that projects move in the right direction.
ProProfs Project is a feature-packed and straightforward tool that offers a complete solution to manage projects. It is an easy-to-use tool, powerful enough to handle multiple projects simultaneously.
The tool offers excellent features that help ease team communication across the organization. These features include task comments, instant messaging, and file sharing. Also, the tool provides an all-in-one platform that offers insightful project reports.
You can view real-time project progress via Kanban boards, List view, etc. These views are convenient to monitor, ensuring that you stay on track and never miss a project deadline.
Overall, the tool is apt for optimizing processes and scaling your business effortlessly.
FREE. All Features. FOREVER!
Try our Forever FREE account with all premium features!
